Target validation by combining Oncolines® profiling and gene dependency screens
References
1. Meyers et al. (2017) Computational correction of copy number effect improves specificity of CRISPR-Cas9 essentiality screens in cancer cells. Nature Genetics 49, 1779-1784.
2. Dempster et al. (2019) Extracting biological insights from the project Achilles genome-scale CRISPR screens in cancer cell lines. BioRxiv, 720243.
3. McFarland et al. (2018) Improved estimation of cancer dependencies from large-scale RNAi screens using model-based normalization and data integration. Nature Communications 9, 4610.
4. Dempster et al. (2021) Chronos: a cell population dynamics model of CRISPR experiments that improves inference of gene fitness effects. Genome Biology 22, 343
5. Pacini et al. (2021) Integrated cross-study datasets of genetic dependencies in cancer. Nature Communications 12, 1661.
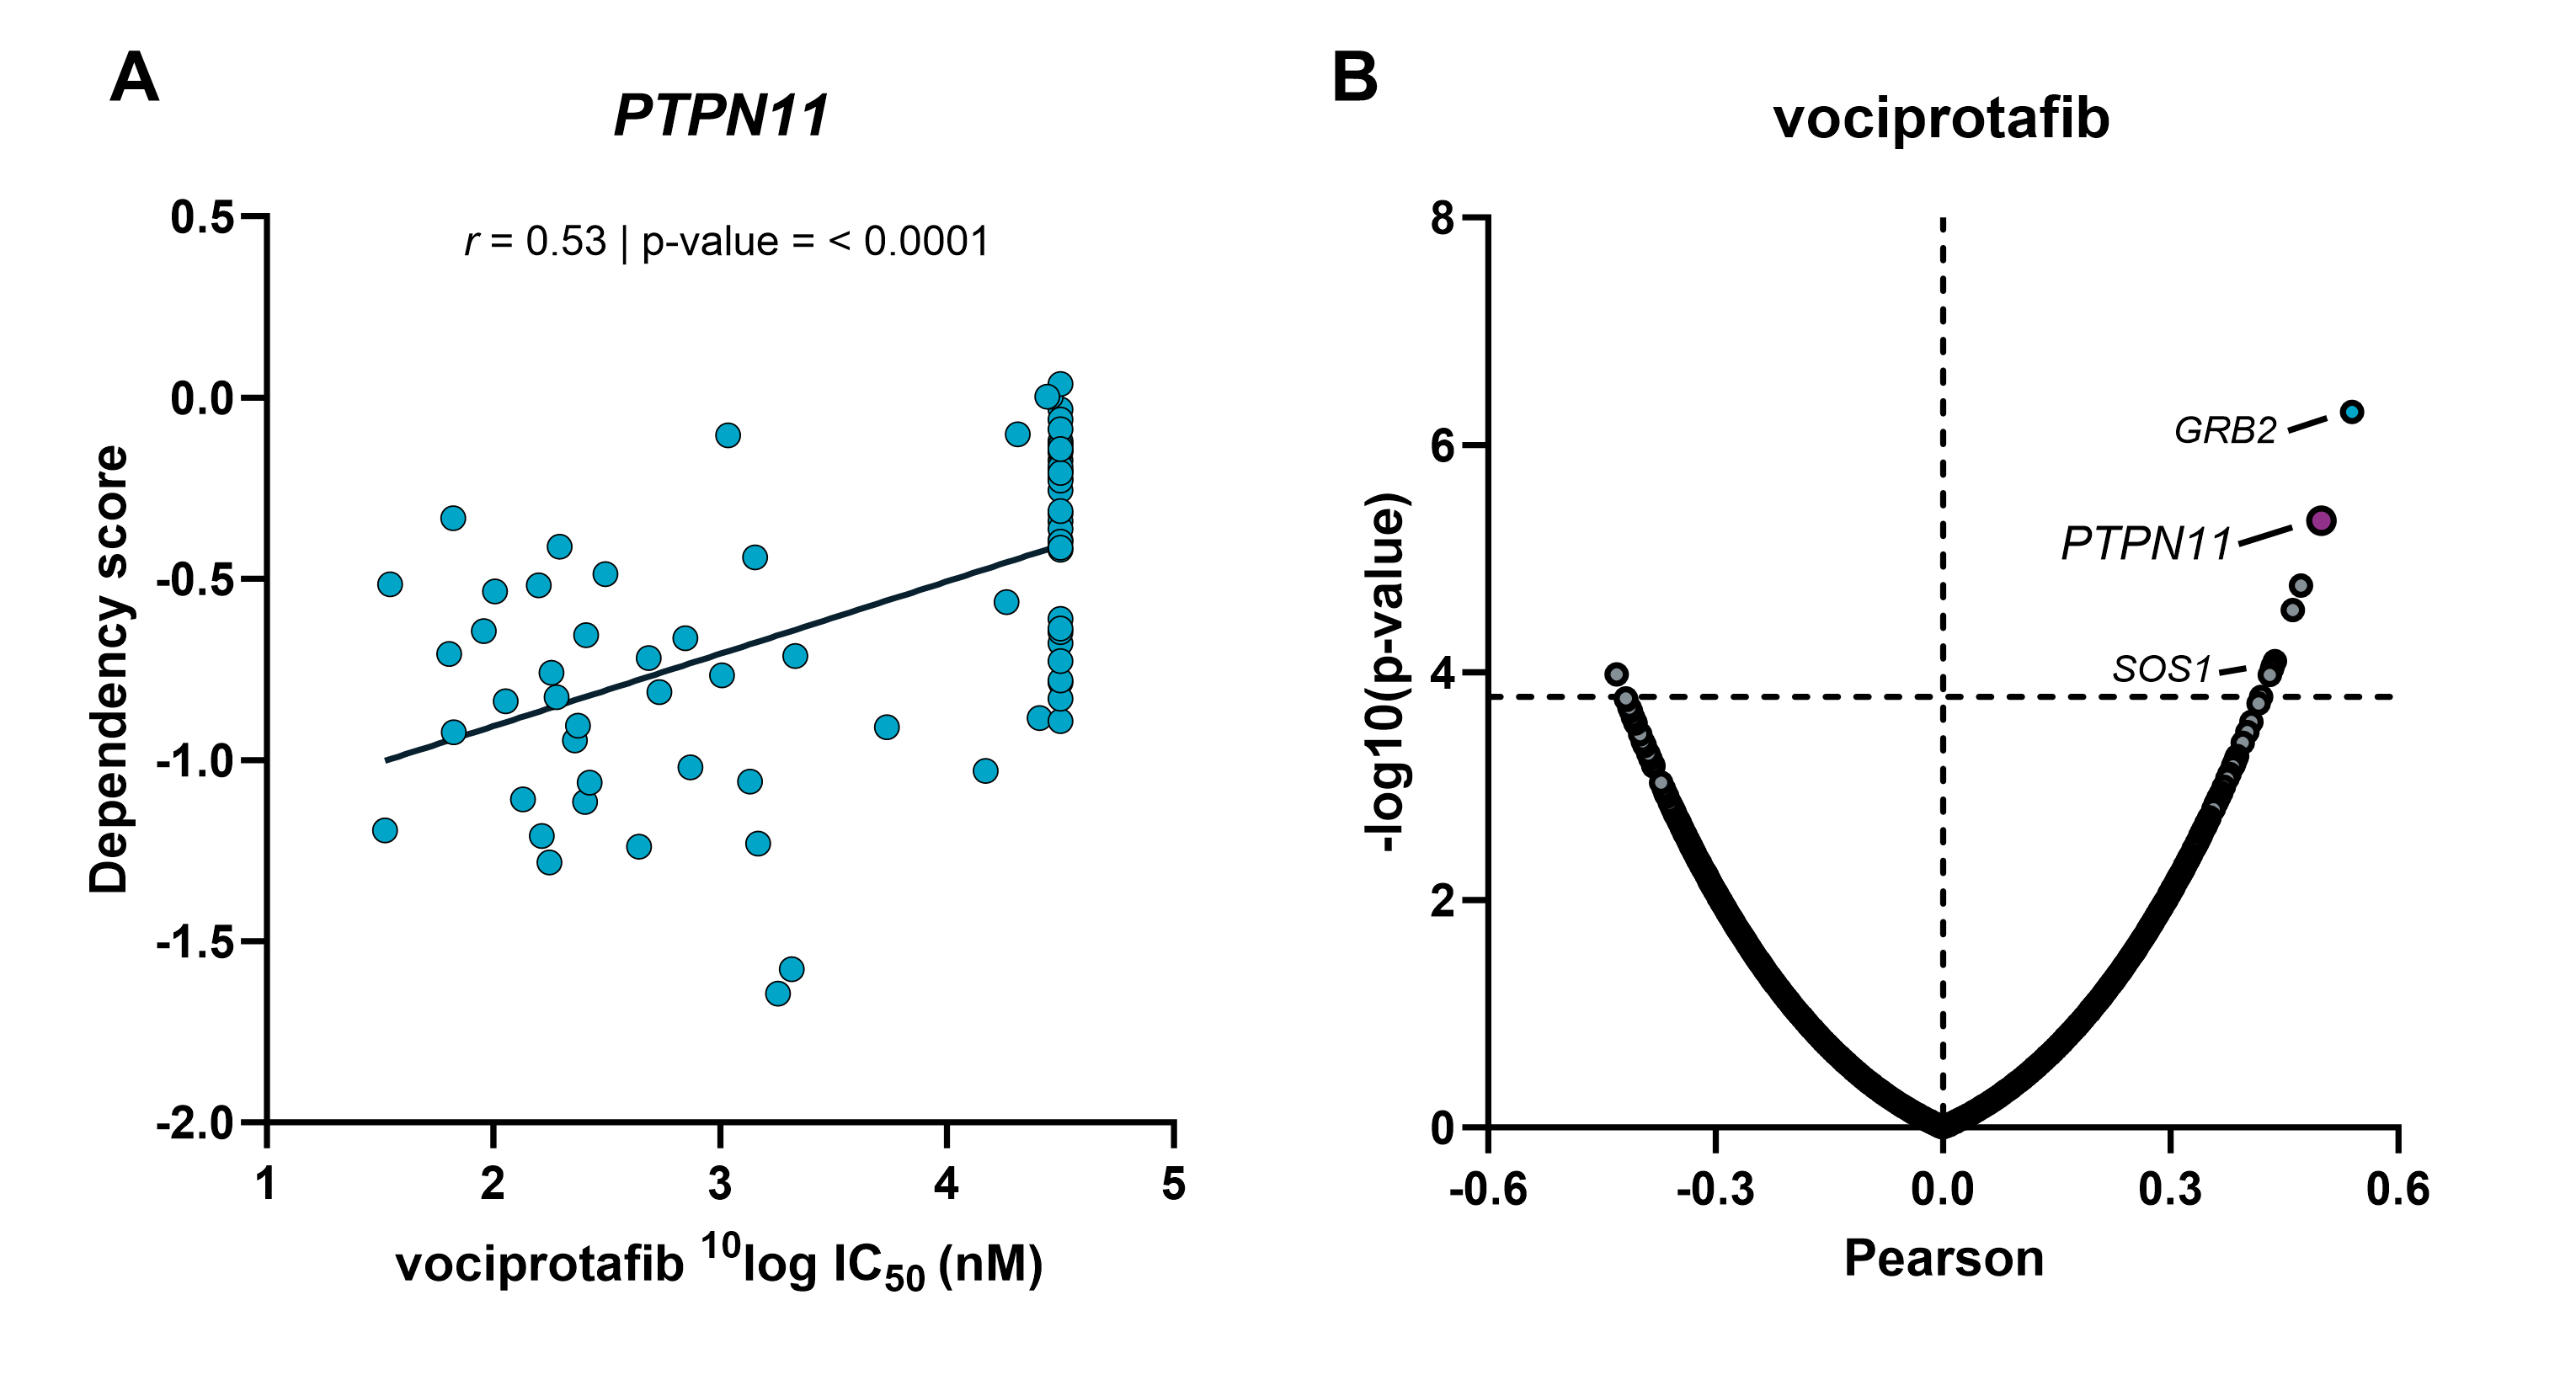
Figure 1 | CRISPR gene dependency correlation with vociprotafib
(A) A scatterplot comparing the IC50 values of the SHP2 inhibitor vociprotafib and the CRISPR gene dependency scores of the SHP2-encoding PTPN11 gene across the 102 Oncolines® cell line panel. (B) A volcano plot of the Pearson correlation between drug IC50 values and CRISPR dependency scors of > 17,000 genes. The horizontal line indicates significance after multiple testing correction.
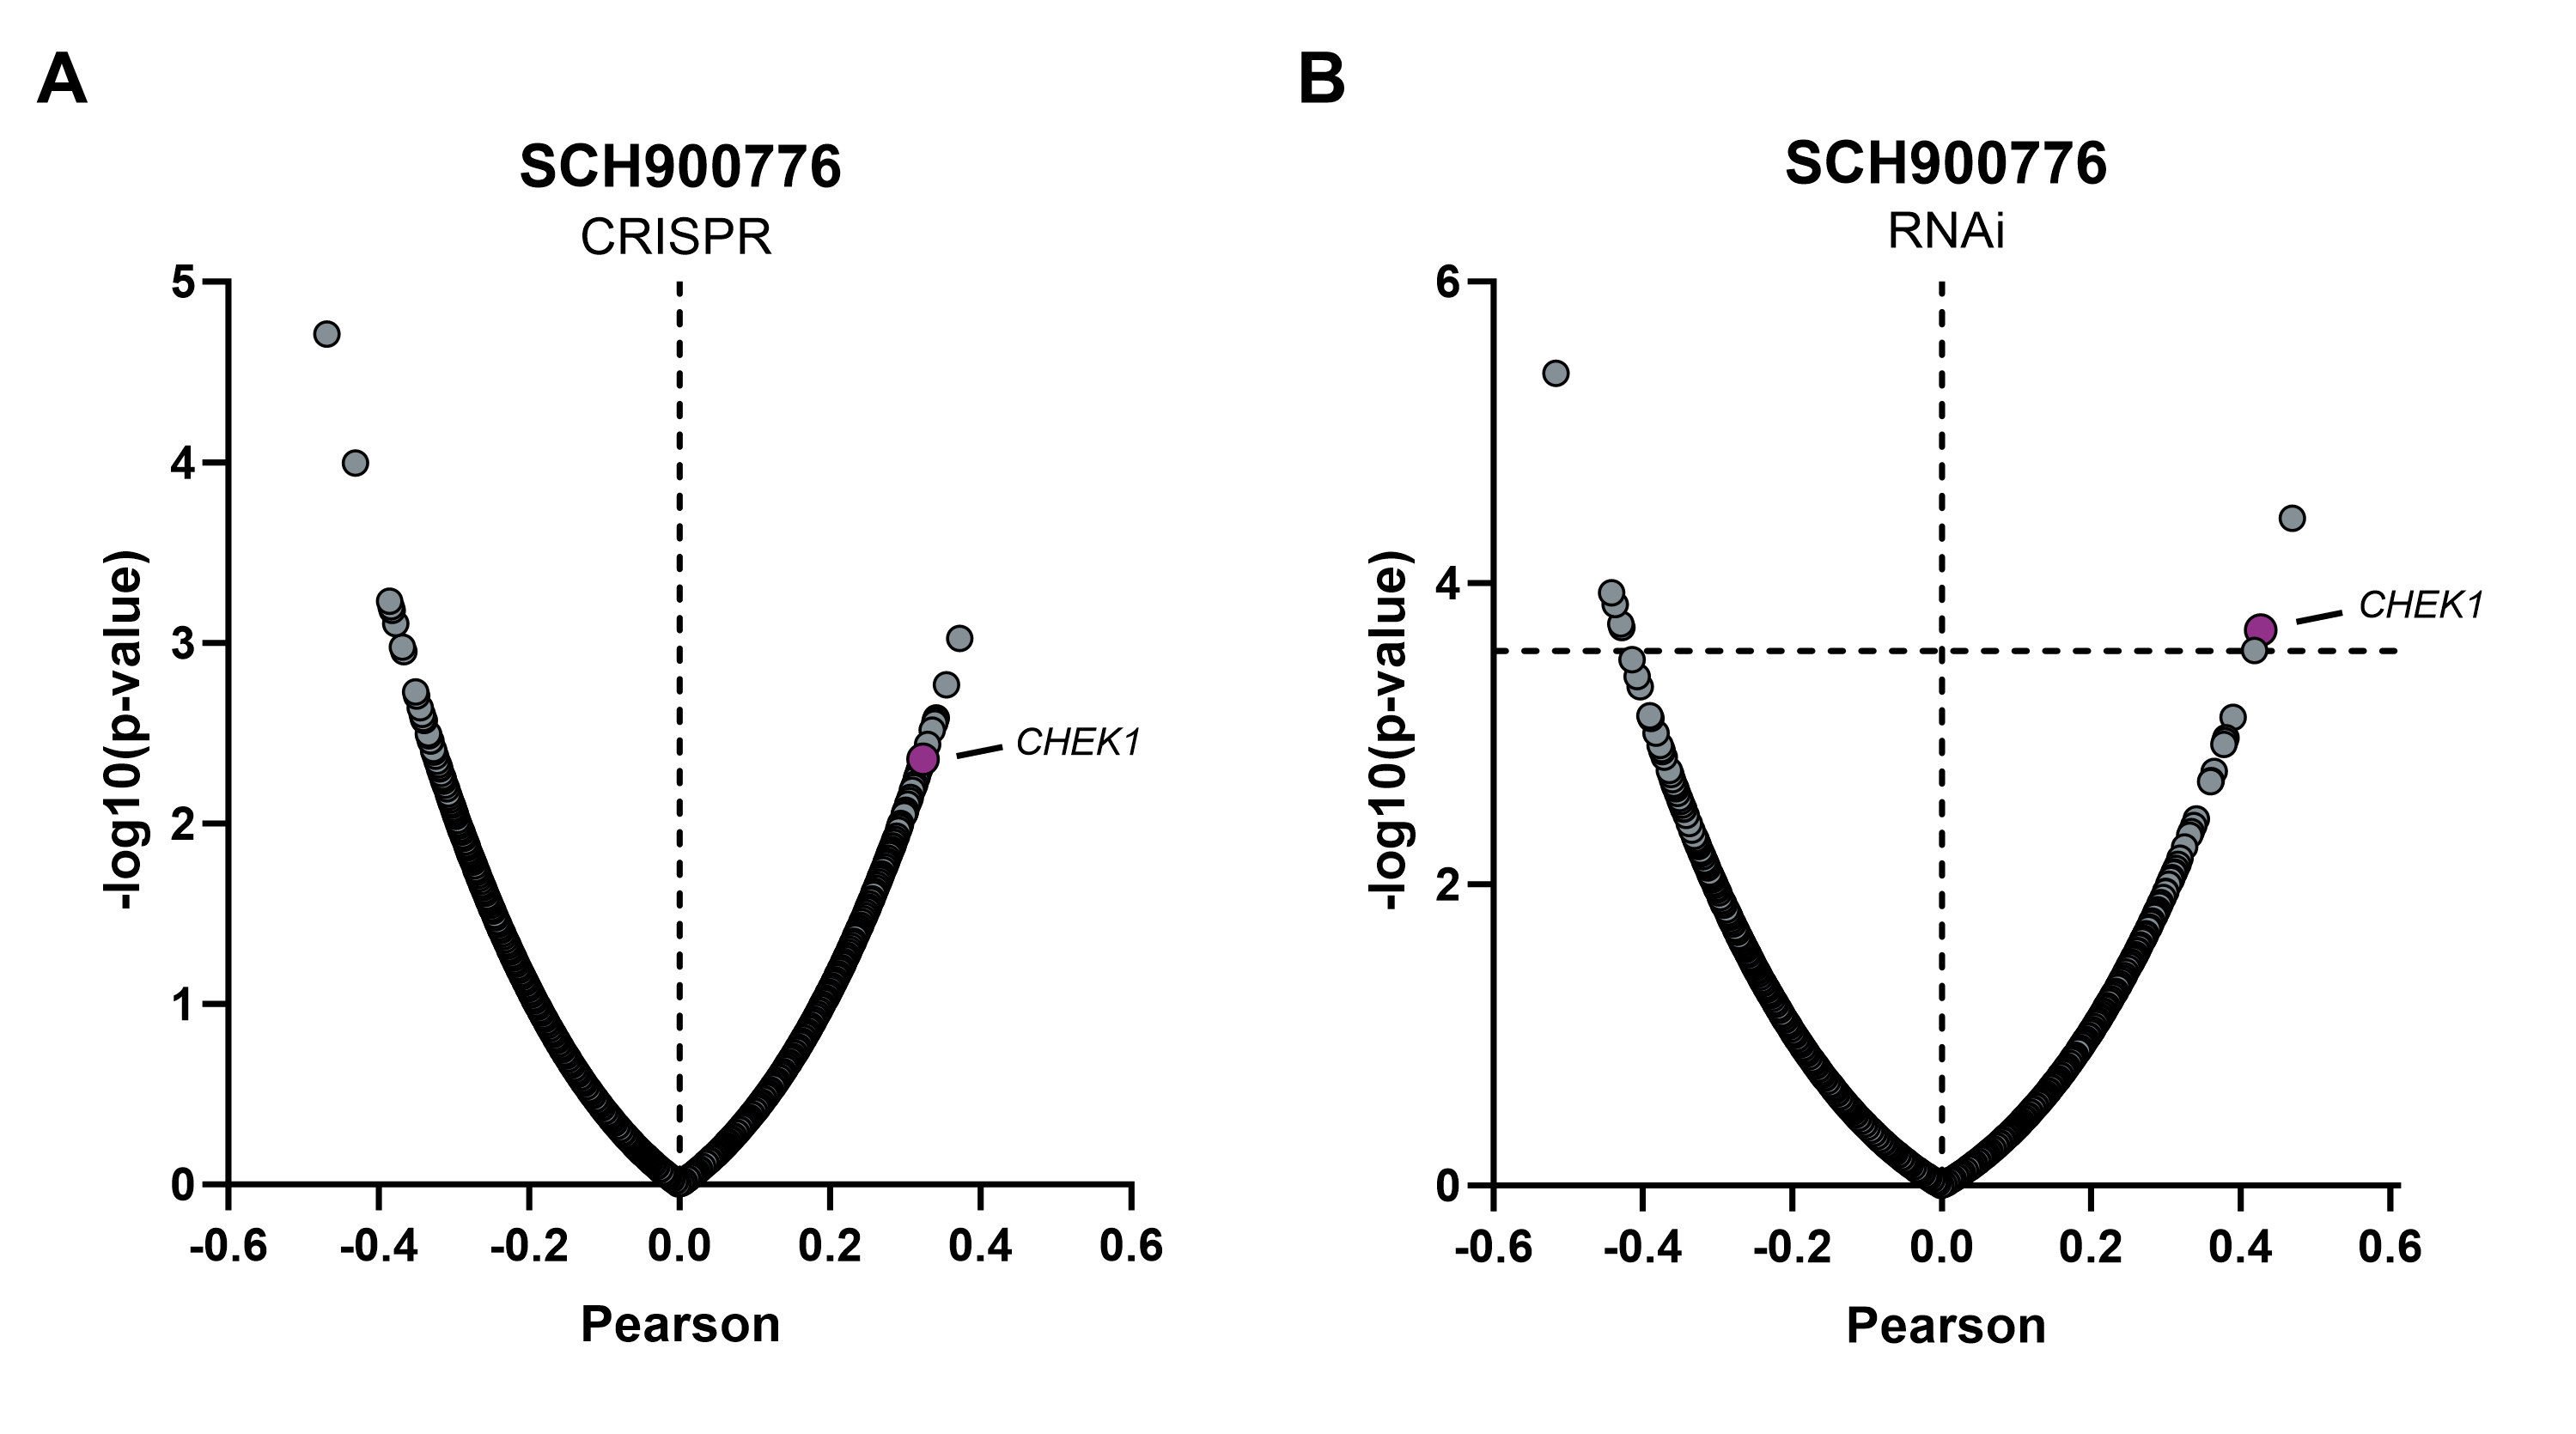
Figure 2 | Difference in gene dependency patterns between CRISPR and RNAi
The gene dependency pattern for PTPN11 (left) and CHEK1 (right) in both the CRISPR (purple) and RNAi (blue) dataset for the 102 cell lines. If the gene has a dependency score smaller than -0.5 it is considered to be essential for cell proliferation.