Stepwise, in-depth cancer gene mutation analysis reveals cellular targeting of KRAS mutant-selective inhibitors

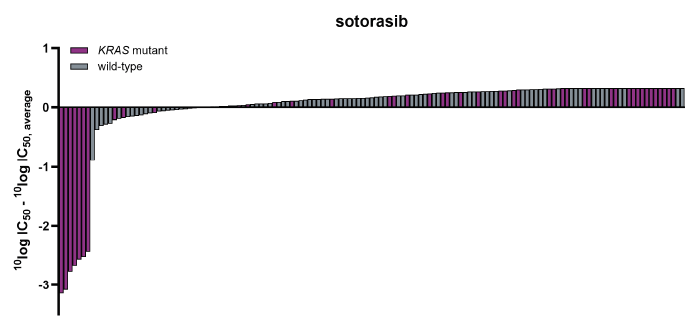
  • Profiling of the KRAS G12C inhibitor sotorasib1 on a panel of KRAS-mutant and wild-type cell lines reveals a differential sensitivity pattern for the KRAS-mutant cell lines (Figure 1).
  • Since this binary cell line grouping based solely on ‘mutant’ or ‘wild-type’ genotype proved insufficient to predict sensitivity, an extended analysis with more detailed mutation annotation was performed.
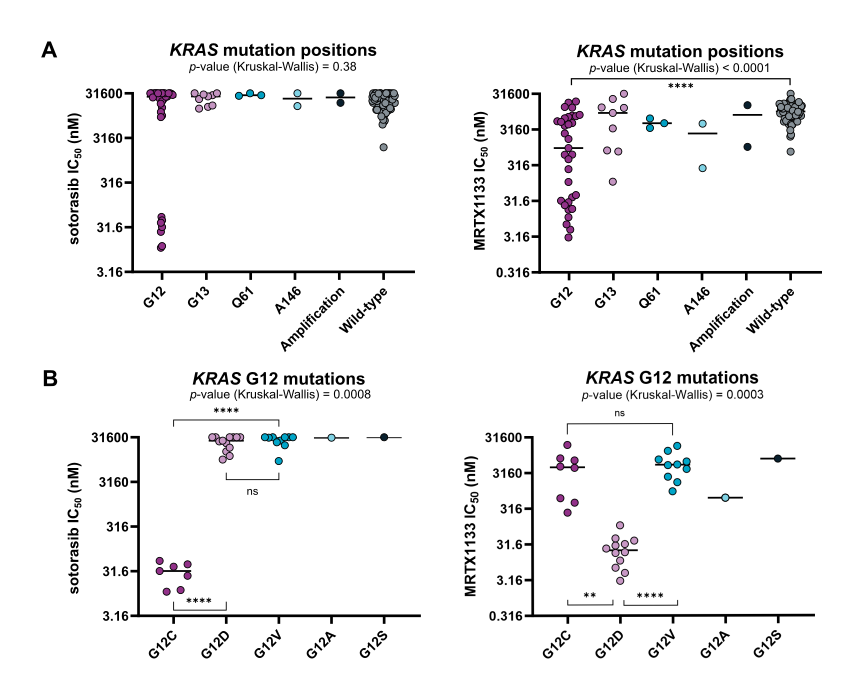
  • Subgrouping of KRAS-mutant cell lines according to the precise amino acid positions of mutations uncovers a sotorasib-sensitive subset harboring mutations at the glycine residue at position 12 (G12; Figure 2A).

  • Further zooming in on the type of amino acid change at position 12 shows that cell lines with a glycine-to-cysteine (G12C) mutation are selectively targeted by sotorasib (Figure 2B).
  • Profiling of the KRAS G12D inhibitor MRTX11332 similarly reveals KRAS G12-mutant cell lines as responders (Figure 2A), with primarily those harboring a glycine-to-aspartic acid (G12D) mutation displaying the highest sensitivity (Figure 2B).

References

1. Canon et al. (2019) The clinical KRAS G12C inhibitor AMG 510 drives anti-tumour immunity. Nature 575, 217–223.
2. Wang et al. (2022) Identification of MRTX1133, a noncovalent, potent, and selective KRASG12D inhibitor. J Med Chem 65, 3123–3133.

Figure 1 | Waterfall plot of responses to sotorasib across 141 cancer cell lines
Waterfall plot showing the ranking of drug response based on relative IC50 values for 141 cancer cell lines profiled with the KRAS G12C inhibitor sotorasib.
Figure 2 | Step-by-step KRAS mutation analysis for sotorasib and MRTX1133
(A) Distribution of sensitivity across cell lines harboring KRAS mutations at different amino acid positions, and (B) sensitivity distribution according to specific amino acid substitutions at the G12 position for sotorasib (left) and MRTX1133 (right). Significance between groups was determined by a Kruskal-Wallis test, followed by a Dunn’s post-hoc test. ** = < 0.01, *** = < 0.001, **** = < 0.0001